Britons Vote to Leave European Union

You may have noticed that I haven’t commented on the Britons’ decision as to whether the United Kingdom should remain part of the European Union or leave it, “Brexit” as that’s been dubbed, a portmanteau of “Britain” and “exit”, a peculiar neologism since to the best of my recollection in the UK exits are frequently labelled “Way Out”. Britons have voted for Brexit. The BBC reports:

Prime Minister David Cameron is to step down by October after the UK voted to leave the European Union.

Speaking outside 10 Downing Street, he said “fresh leadership” was needed.

The PM had urged the country to vote Remain but was defeated by 52% to 48% despite London, Scotland and Northern Ireland backing staying in.

UKIP leader Nigel Farage hailed it as the UK’s “independence day”, while Boris Johnson said the result would not mean “pulling up the drawbridge”.

Scottish First Minister Nicola Sturgeon said she was “absolutely determined” to keep Scotland in the EU so a second Scottish independence referendum was now “highly likely”.

A regional and demographic analysis of the patterns of voting would be interesting and there are maps of the regional results here. My off-hand guess, supported by the maps, is that native English voted to leave. Note that in the north of England 70% or more voted to leave, in the Midlands, the west of England, Cornwall, and Wales majorities voted to leave, while in Scotland, the home counties, and areas surrounding other major cities majorities voted to remain.

On the merits of leaving or remaining, I really have no view. I think that a European free trade zone makes sense, the European Union, essentially a government without a country run by unelected bureaucrats, makes less sense, and the euro makes no sense at all.

For the last century and a half if not longer the Germans have had a persistent project to Germanize Europe. In the 20th century two world wars were the outgrowth of that project; in the 21st century its primary engine has been the European Union. The Germans are not philanthropists. Their idea of a European Union will inevitably be run according to German preferences and to benefit Germans. It seems to me that, sensibly, ordinary Britons recognize that.

I have pointed out repeatedly that our European cousins have a choice to make. They can be the ethnic states they’ve always been or become multi-ethnic and multi-cultural. They can’t straddle, at least not effectively. I suspect there was a tinge of a desire to remain British in the Britons’ vote to leave the EU.

Note that the polls that predicted as some did that Britons would vote to remain were gigantically wrong. I think that increasingly respondents are telling pollsters what they think the pollsters want to hear and that phenomenon isn’t limited to the United Kingdom.

34 comments

Chaos or Decadence?

In reading this post keep two things in mind. First, I’ve already acknowledged that I don’t understand what’s happening this election cycle. My intuition is that something very, very different from what has gone on all through my adult life is occurring but I have no idea what the outcome will be. The second is that I don’t like either Hillary Clinton or Donald Trump and can’t envision myself voting for either one of them.

I’ll open with a little snippet of Matthew Hennessey’s recent post at City Journal:

The dominant and disorienting attribute of America in 2016 is that nothing is what it seems or, more accurately, what it actually is. On the campuses, intolerance is tolerance and censorship is free speech. In our public bathrooms, boys are girls and men are women. In our cities, the forces of protection are the forces of aggression. Stagnation is recovery; poverty is prosperity; war is peace.

Media cynicism has lately devolved into “don’t believe your lyin’ eyes” absurdity. In Orlando, according to the New York Times, an Islamist terrorist attack is somehow the product of Christian intolerance. In a bold display of cynicism about what its readers are willing to believe, the Times published an editorial pinning blame for the murder of 49 people in a nightclub not on the man who pulled the trigger—and pledged allegiance to the Islamic State and its leader, Abu Bakr al-Baghdadi—but on GOP lawmakers “who have actively championed discriminatory laws and policies.” Omar Mateen’s victims, the Times said, were not the latest casualties of Islamism’s long war on the West but rather “casualties of a society where hate has deep roots.”

I think he’s reacting to the same things I’m seeing.

If you look at what the pundits, pollsters, and media outlets are saying, it’s dizzying, as if looking through a funhouse mirror. The only thing that’s clear to me is that they’ve learned nothing.

Their hatred of Donald Trump is obvious as is their defensiveness about Hillary Clinton. Look at the stories they’re running with as if in a pack. The Trump campaign is broke. How weak his campaign organization is. How damaging his policy positions are.

If fundraising from major donors, a strong, seasoned campaign organization, and solid, coherent policies were dispositive, Jeb Bush would be the undisputed Republican candidate. He isn’t. He fell on his face. I think that what that all of that tells us is that the yardsticks we’ve used in the past just aren’t worth much in this election cycle.

Something else to keep in mind: three-quarters of primary voters voted for neither Hillary Clinton nor Donald Trump. Based on the tone of what I’m hearing, concluding that Democratic primary voters will come home to Hillary or Republican primary voters will rally ’round Trump are just lunacy.

12 comments

Telling the Story With a Chart

ChinaEnergySource20160623

I encourage you to read Gail Tverberg’s ingenious analysis of Chinese economic growth at The Energy Collective, told through the prism of energy consumption and the development of energy resources. In it she speculates that the slowdown in China’s economy is a consequence of incipient “peak coal”.

But that’s not the subject of this post. The graph at the top of the page is. Looking at that chart you might come away with the idea that in the last couple of years China has seen bumps in the Chinese consumption of renewables, hydroelectric power, nuclear power, and natural gas.

But it hasn’t. There have been increases in all of those, yes, but no bumps. What there has been is an absolutely enormous bump in Chinese coal production and the consumption of energy derived from burning coal.

What gives that impression is the arrangement of the various energy sources in the chart. If coal had been placed at the top and all of the other sources placed below coal, it would have told a much truer story—a story of increasing energy production of all sources and, until quite recently, gigantic increases in Chinese production of coal.

I’m filing this under “Visualcy” but you could have an entire blog devoted to how to tell stories with your visuals. People believe an enormous number of untrue things because the untruths have been shown to them in a clever way. I’m not suggesting that Ms. Tverberg manipulated that chart deliberately. Not at all. But she couldn’t have told that particular story better if she had.

3 comments

To Laugh Or To Cry?

I think that this is unquestionably the funniest thing I’ve heard all day. The FBI has lost track of the wife of Omar Matteen, the perpetrator of the Orlando massacre:

Attorney General Loretta Lynch admitted today that the FBI is unaware of the whereabouts of Omar Mateen’s wife, Noor Salman.
Salman has indicated she suspected Mateen was about to commit a terrorist attack, and even accompanied him to buy the weaponry he used to carry out the massacre. She insists, however, that as he left she tried to hold onto his arm so he wouldn’t leave.
If the FBI believes she was aware of the impending attack, she could be prosecuted.
“Has the shooter’s wife left the state of Florida?” a reporter asked Lynch during her press conference Tuesday.
“Right now, I don’t know exactly the answer to that,” Lynch candidly replied. “I believe she was going to travel but I do not know exactly her location now.”

Maybe it’s not as bad as it sounds. It would be pretty darned hard for it to be as bad as it sounds.

7 comments

2016 Social Security Trustees’ Report

The Social Security Trustees’ report for 2016 has been published. The Washington Post reports that it bears good news and bad news:

The trust fund used to pay hospital insurance costs for Medicare will be wiped out two years earlier than expected, according to a government report released Wednesday.

The report also showed that the Social Security trust fund has enough cash to pay full benefits for another 18 years, the same timeline as last year, the Treasury Department said Wednesday. In the latest annual check-up on the two largest entitlement programs, the trustees overseeing both Social Security and Medicare said additional reforms are needed in order to avoid cutting health care and retirement benefits for American retirees.

“Social Security and Medicare remain secure in the medium-term,” said Treasury Secretary Jack Lew. “Nevertheless, future solvency challenges for both programs remain.”

The report itself is here.

If you’re wondering what the good news is:

In one bright spot of the report, the fund used to pay benefits for people with disabilities — which was set to run out of funds by the end of this year — should last at least through 2023. Congress made changes last year that directed more cash to that part of the program by reallocating money from the trust fund used to pay benefits to retirees and survivors.

A number of years back I wrote a series of posts on Social Security and a lively discussion ensued. I may try to dig them out. As I recall everything I said at the time is more obviously true than it was then. It’s clearly impossible for ordinary people to save enough for their own retirements. When you’re getting .75% interest on anything remotely secure?

I have a pretty distinctive take on Social Security. Not only do I think that the program will remain more or less intact for the foreseeable future, I think that its primary problem isn’t that there aren’t enough people contributing as that not enough income is subject to the tax.

The last thing we need is a big influx of people earning minimum wage and lining up for benefits on down the road.

Whether we continue with the bizarre fund accounting is another question. So DI has six years of life, Medicare has 11, and SSRI has 18. Get used to this being the big topic for the next several administrations. I love the smell of napalm in the morning!

What we really need is more robust economic growth. Care to make a small cash wager on whether we’ll have another “lost decade”?

4 comments

The Long Tail Wags the Dog

I found this post at the Daily Caller both amusing and a little sad:

A small group of pro-President Barack Obama commenters dominated conversation on the White House Facebook page during the last five years, according to a data analytic firm’s examination of 3.6 million posts by more than 515,000 unique profiles.

The firm’s analysis and a Daily Caller News Foundation investigation suggest digital astroturfing may have been behind many of the most frequent commenters. “Astroturfing” refers to efforts aimed at creating the appearance of more public support than actually exists for an individual, institution, program or proposal.

Twenty-four percent of the 3.6 million comments on the page since 2010 were posted by only 250 profiles.

Just four profiles account for nearly 60,000 comments over a five year period. Either there are some very lonely people out there with a lot of time on their hands or, as I think is somewhat more likely, they were the work of professional social media image management consultants.

4 comments

Carrier Performance After OE3

CarrierPerformance-OE3
There’s an interesting report from McKinsey & Co. that puts a little flesh on the bones of the subject I mentioned yesterday on the financial performance of healthcare insurance carriers in the Marketplace following the third open enrollment (known colloquially as OE3):

The third open enrollment period (OEP) for the public exchanges concluded in January. Many carriers—both early-OEP entrants and “wait-and-see” latecomers—believed this new market would achieve stability and sustainable margins in its third year. However, recent events—including carrier turnover (both entrances and exits), plan terminations, and pricing volatility—suggest the market is still in flux.

One reason for the flux is the variability of individual market financial performance many carriers have disclosed publicly. For some carriers, significant losses are causing marked changes in enterprise-level capital, cost structures, and strategy. Early indications of 2015 performance suggest aggregate negative margins may have doubled; to date, however, only 86% of carriers have released preliminary data publicly.

We anticipate that our estimates will evolve as more information is released, such as final 3R results and rebates, as well as 2015 claim run-out and adjustments. Whether carriers’ performance in the individual market will improve in 2016 remains unclear.

I found the map at the top of this post (labelled “Exhibit 1”) particularly interesting. What are the critical success factors for carriers in the Marketplace? I suspect that they are

  • Whether the states had adopted some or all of the reforms of the PPACA previous to the enactment of the legislation, e.g. California, Washington
  • The size of the pools, e.g. California
  • The carriers’ breadth of experience within their states, i.e. I suspect that new carriers fared poorly
  • In the case of small states: dumb luck

but I’d be interested in hearing the opinions of others.

New York presents an interesting test case. The state had adopted many of the reforms of the PPACA prior to the law’s enactment and its pool is certainly large enough. Why are so many carriers there having problems?

The other observation I would make is that in a small state having only a single carrier that’s making money may not be a mark of success. Next year no carriers may make money. Or the carrier that made money this year may lose money next year. In a small insurance pool plain old dumb luck can be the determining factor.

8 comments

This Week’s Forum Question

The question this week at the Watcher’s Council forum was about the Obama Administration’s refugee resettlement program. As you might guess, the Council members were ag’in it.

Here was my submission:

I think it’s ill-conceived. There’s one thing that He Who Must Not Be Named is right about: we don’t need more immigrants, particularly immigrants who don’t speak much English, may or may not have any marketable skills, and who are impossible to screen.

However, there is a group of Middle Easterners and West Asians that we should accept. There are about 50,000 Afghan and Iraqi translators who have helped us over the last 15 years. They have the advantages of speaking at least some English, being (presumably) reasonably favorably disposed towards us, and they’ve already been vetted at least as well as we can vet people in the Middle East and West Asia. And we owe them a debt of honor.

So, forget the Syrians. Let the Germans take them. We should expedite the visas of Iraqi and Afghan translators and their families. We owe it to them.

4 comments

Equilibrium or Death Spiral?

The answer is that we don’t know. Megan McArdle has a pretty good post at Bloomberg in which she muses over the in all likelihood double digit premium increases that will hit the insurance plans offered under the PPACA:

What does that mean for the future? A few months back I was on a panel with a very smart health-care reporter who said, basically, “Yes, there will be rate hikes, but there is some price at which insurance can be sold profitably, and eventually, insurers will figure out what that price is.” My response was that this isn’t necessarily true. Insurance markets have some interesting features, one of which is that it is quite possible for there to be no price at which insurance can be profitably sold.

In health insurance markets, this phenomenon is known as the adverse-selection death spiral. Basically, every time the price of insurance goes up, many of the people in the insurance pool who use the least health care decide that it makes more sense to go without the insurance and bear the risk themselves, and they drop their coverage. That means you’re left with the more expensive patients to cover, which means the average cost goes up, which means prices have to go up … and, well, you get the idea. The price the market eventually finds may be so high that very few people want to buy the insurance.

We’ll know whether an equilibrium price has been reached if future premium prices rise no faster than other healthcare insurance premiums and the number of policies sold continues to increase. If the number of policies sold takes a nose dive or premiums rise in double digits while healthcare insurance premiums off the Marketplace rise at some slower rate, the PPACA will be collapsing and we should probably have a plan for what we do then.

3 comments

It’s Not Just the “Rich”

UI20160621

The graph above, taken from a new report from the Urban Institute, is a bit misleading. It doesn’t depict income quintiles or quartiles. It depicts income “classes”. “Rich” denotes families earning more than $350,000 per year; “upper middle class” denotes families earning from $100,000 to $350,000 per year; “middle” denotes families earning $50,000 to $100,000 per year; “lower middle” denotes families earning $30,000 to $50,000; and “poor” denotes families earning less than $30,000 per year. The number of families in each class varies.

The report does not control for geographical location. So, for example, despite being classified as “rich” a family that lives in Hawaii or Alexandria, Virginia with an income of $350,001 might actually have a pretty modest lifestyle.

Here’s the point: the real dichotomy isn’t between the top 1% and the bottom 99%. It’s between the “rich” and “upper middle class” and everybody else.

More than 29% of Americans are classified as “upper middle class” and here’s the report’s summary of who they are:

Finally,ongoing research will focus on the demographic characteristics of the growth of the upper middle class and rich by family status, education, and race/ethnicity. The upper middle class and rich in 2014 were composed predominantly of people who were married or cohabiting (82 percent in 2014 and 86 percent in 1979), who had a bachelor’s or graduate degree (30 percent in 1979 and 59 percent in 2014), and who were non-Hispanic whites (79 percent in 2014 and 93 percent in 1979).

and here’s mine. They’re mostly white, mostly older, mostly married, and mostly professionals, MBAs, business owners, or managers working for larger companies.

Also, a middle that encompasses a range of incomes from $30,000 to $350,000 a year and accounts for most Americans makes a hash of the idea of “middle”. I think that the Urban Institute needs to recalibrate its income classes.

Update

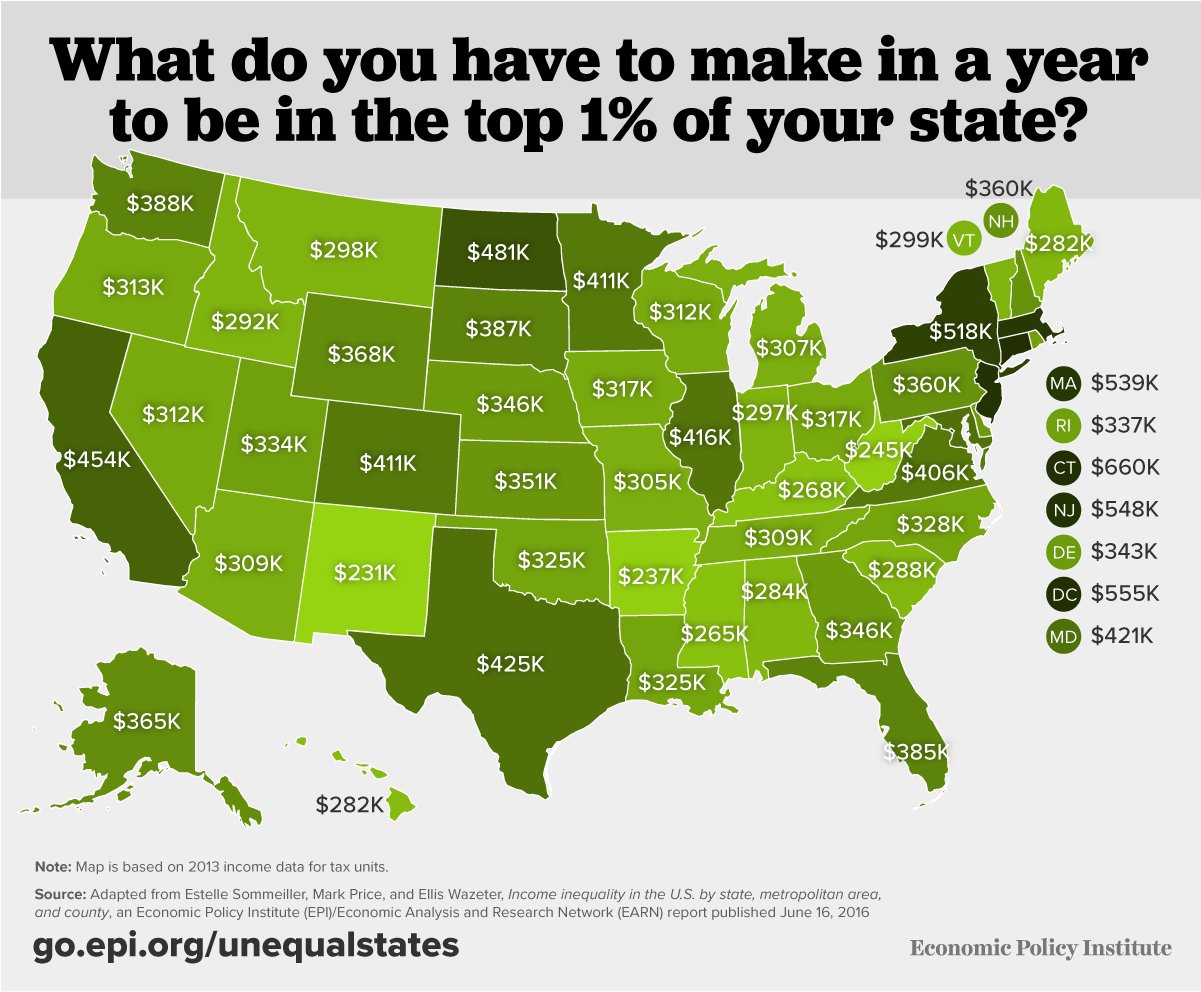
This map, er, sampled from a post at Fiscal Times, should show you what I mean by my comments above about controlling for geographical location:

In some states, e.g. New York, $350,000 a year doesn’t even get you close to the top 1% of income earners. In others, e.g. New Mexico, Arkansas, it would put you a lot higher than that.

4 comments