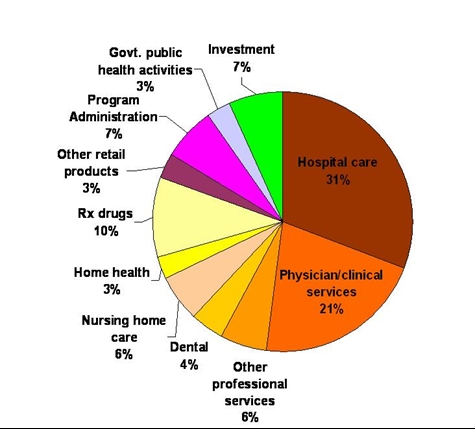
I’m posting this graphic, courtesy of the Kaiser Family Foundation, largely for future reference. Although I’ve read other estimates elsewhere, the estimates in that chart comport with most of the estimates I’ve read and with my own experience.
As you can see hospital care and physician/clinical services accounts for the majority of costs, 51-52%. However, if you pry a little more closely into nearly all of the expense items represented by slices of the pie, they boil down to wages. Physicians’ wages, dentists’ wages, administrators’ wages, pharmaceutical companies’ executives’ wages, all of the wages in the sector.
If someone were to ask me what I would do to reduce healthcare expenditures in the U. S. with a wave of my magic wand, I’d answer “cut healthcare wages in half”. If that were to be done, physicians, broadly, would still be earning more than their OECD counterparts and we’d still be spending more per capita and overall than any other OECD country but we wouldn’t be spending three times as much as the next-largest spender.
If you were to ask me how we got to where we are now, I’d answer “historical error”. Forty years ago we ignored rising healthcare costs (and wages!). After that initial period which ended around 1980 most of the increase can be explained by inflation (that healthcare inflation is a large component of the general rate of inflation so, consequently, cost of living adjustments in healthcare that are in line with the general rate of inflation creates a positive feedback situation is a subject for another time).
For those who believe that our high healthcare expenditures are due to something else, I have a question: how is price discovery done in healthcare?
One of the explanations frequently given (including in the link above), technology, is IMO hooey. The Japanese use high tech procedures as frequently as we do (in some cases more frequently) and their costs are a fraction of ours with better outcomes. Besides, actual ledgers for hospitals, etc. don’t show that. What they show (at least in my experience) is increasing costs of labor.
Another explanation given at the link is likewise hooey. It is mathematically impossible for prescription drugs to be the primary driver of healthcare expenses. It only comprises 10% of expenditures. That’s nearly the amount by which healthcare expenditures increased last year. It might be growing fast but it isn’t the primary driver.


Or, you can just raise the tax rate and get the money back again.
At one level a lot of people are going to hate that, but the bitter truth might be that this is actually one of the few possible paths.
The tax rate is a “single point of recovery” which addresses social security benefits to high income retirees, over-compensated government employees, and wage bloat in health care.
On your main theme, I think a good way to re-do the pie chart would be per-patient. That is, how does the pie look (in size and division) for a typical healthy person here, and in lower cost countries. Then, how does the chart look for a cancer patient, here and there.
Do we even know if we over-spend on the healthy(*), or if it is all on the disease side?
* – Not sure where statin-takers like me fall these days. In the old days I’d be considered healthy, and told to change my diet. Now I pay out for pills, and periodic blood tests.
(Maybe that last note is it, and our health care industry has been too successful at converting the healthy into chronic patients.)
I can’t answer that question but I can answer a closely related one. Somewhere around here you’ll find a chart that compares healthcare spending in a number of OECD countries including the U. S. by age cohort.
We actually spend less in every cohort below age 60 than France, Germany, or the UK. If we were to reduce our spending on those over 60 to the level of France, Germany, and the UK, our healthcare spending would be lower on a per capita basis.
Where does labor fit in the hospital cost conundrum?
“William Bertschinger, divisional chairman of finance at the Rochester, Minn.-based Mayo Clinic, told an audience of providers and payers in January that 70 percent of the high cost of healthcare is due to labor costs.
‘There are too many full-time employees and too many employees paid at too high a rate,’ he said in a speech at the Symposium on Payment Solutions for Healthcare Providers and Payers in Las Vegas.”
http://www.healthcarefinancenews.com/news/where-does-labor-fit-hospital-cost-conundrum
It is not inflation Dave. Inflation is a monetary phenomenon. It is rising costs which is a different issue altogether. I’d say the problem is largely one where the care people get is not constrained by the ability to pay. While good in terms of ensuring that people get life saving care, it is not so good in terms of controlling costs.
In other words, our problem is really a medicare problem.
“However, if you pry a little more closely into nearly all of the expense items represented by slices of the pie, they boil down to wages. Physicians’ wages, dentists’ wages, administrators’ wages, pharmaceutical companies’ executives’ wages, all of the wages in the sector.”
Not surprising, its basically a service business. Its cost structure is not like an plastic injection molder where resin might be 50% + of costs. Its people. I hope the comment about halving wages was tongue in cheek. In free societies we have ways of dealing with this.
Which leads to this: “how is price discovery done in healthcare?”
Its not. Rather, for the most part the patient consideraton is whether a third party payer covers it – is it “free.”
Which leads to this: “We actually spend less in every cohort below age 60 than France, Germany, or the UK. If we were to reduce our spending on those over 60 to the level of France, Germany, and the UK, our healthcare spending would be lower on a per capita basis.”
If is was simply a wage problem you would expect the US to spend more for under, as well as over, 60 year olds. And 60 is an interesting age to think about, because what happens at 60? The incidence of expenditures begins to increase dramatically. (Actually, probably more like 55, but I’d leave that to someone more knowledgeable, like steve.)
Other countries solve this problem by restricted access. We throw the kitchen sink at it. And that costs money, especially since from the patients point of view health care is “free.”
“After that initial period which ended around 1980 most of the increase can be explained by inflation..”
I think that statistic is numerically accurate, but analytically suspect, and about to be blown up. For the same reason I cited in the previous paragraph, the baby boom generation hitting the health care issues years will make inflationary increases look mild.
Again, the physician portion of those costs is about 6%. Cut those in half, and specialists till make more than OECD docs. PCPs might not. OECD docs also usually have school paid for, and they get cheaper health care. But, you are on the right track.
What you want to do is decrease the spending that docs create. That will indirectly lead to their salaries going down. Set guidelines, and anyone going over those in terms of procedures, stops getting paid unless they can successfully appeal it. No new devices or tests unless they prove cost efficient. (I doubt cutting nurse salaries in half will work. They are already difficult to find.)
Steve
“What you want to do is decrease the spending that docs create.”
Bingo! This of course will set off a debate on 1) defensive medicine and the role of health care tort reform, 2) end of life decisions and other moral issues, 3) the effectiveness of various treatment modalities etc. But its where we have to go.
And I know you (steve) have in the past laughed off my suggestions at bringing consumer price decisions into the mix, but it is simply axiomatic: when the consumer perceives, rightly or wrongly, that something is “free” we can expect abnormal demand and (upward) pricing flexibility by the provider.
I’m not smart enough to say exactly how we bring price into the equation, I just know if we don’t we are just hampsters running on the wheel.
If I laughed I was probably being grumpy. I think you are sincere, but so am I. The problems is that I dont see many areas where you can really make markets work. I wish I did since it would simplify things. I would be happier if I had some model based on market principles that was working well.
I think that we can do some things. We should make Medicare Advantage compete against Medicare FFS. We should look at value based insurance. We could fairly easily promote a lot more transparency. The big problem I cannot see how to get around is the presence of insurance. How do you pay for care that you may suddenly need that will cost the same as new Mercedes 500 series? Even if we reduce costs to European levels, quality care still costs a lot. As long as you have insurance, the system can be gamed.
Steve
In 2008 the Massachusetts legislature directed the Attorney General to subpoena all insurer and provider prices. Her report, issued on March 16, 2010, “Examination of Health Care Cost Trends and Cost Driversâ€, found that roughly three quarters of premium increases during 2004-2008 were the result of “unit price” inflation — providers charging more each year for the same services (see this link: http://www.mass.gov/Cago/docs/healthcare/final_report_w_cover_appendices_glossary.pdf). Had premiums grown during the last decade at the same rate of GDP (reflecting inflation plus productivity) the average family would have taken home an additional $26,477. The difference in 2010 alone was $4,319. If the Massachusetts AG report is reflective of larger health trends, of the $43,993 in cumulative premium increases during 2000-2010, $16,955 would have constituted excess inflation (a polite word for price gouging.) Not surprisingly, after being held in check throughout most of the 1990s, health compensation exploded in the 2000s, with real wages and benefits growing about five times faster than compensation in other sectors. About 70 percent of health costs are attributable to labor. PSH