To be completely honest there’s a lot that I like in Noah Smith’s post, an attempt to explain “Bidenomics”. Some of his points are points I’ve made myself:
- Cuts in marginal tax rates have not increased business investment.
- Cuts in marginal tax rates have not resulted in people working more.
- Income inequality has risen sharply since 1980.
but, since I disagree with the premises of his post, it’s hard for me to agree with his assessment of the Biden Administration’s economic policies. Here are his premises:
The last economic policy paradigm, bequeathed to us by Ronald Reagan (and Paul Volcker), was based around tax cuts, deregulation, welfare cuts, and tight monetary policy. These were intended as remedies for the two main economic problems of the 1970s — slow growth and inflation, together known as “stagflationâ€. The idea that tax cuts boost growth comes from basic economic theory; in almost any model, taxes distort the economy (except for things like carbon taxes), so if you cut taxes it should make the economy more efficient, thus increasing growth at least temporarily. The idea that deregulation boosts growth was more of an article of faith — since “regulation†means a ton of different things, there’s no economic model that can capture it in a general sense (actually deregulation really started under Carter, who arguably did more than Reagan). Welfare cuts were partly based on economic theory — means-tested welfare programs are a form of implicit taxation, which theoretically discourages people from working — and part dogma about a “culture of dependenceâ€. As for tight monetary policy — or more accurately, an anti-inflationary bias at the Fed — that was obviously just a response to inflation.
We can argue back and forth about whether the Reagan paradigm ever boosted growth; in fact, I don’t know the answer. The late 80s and 90s were good years for American incomes and the 90s and early 00s were good years for productivity. How much tax cuts and deregulation had to do with that is up for debate, and how much the country benefitted from reduced inflation is also arguable.
But it’s clear that by the 2000s and 2010s, the Reaganite paradigm wasn’t doing what it was supposed to do.
What should be apparent is that for his analysis to hold water we must, indeed, have cut taxes, deregulated, cut welfare, and had tight monetary policy. Did we? I would submit that by objective measures none of those things has happened. Let’s start with taxes:
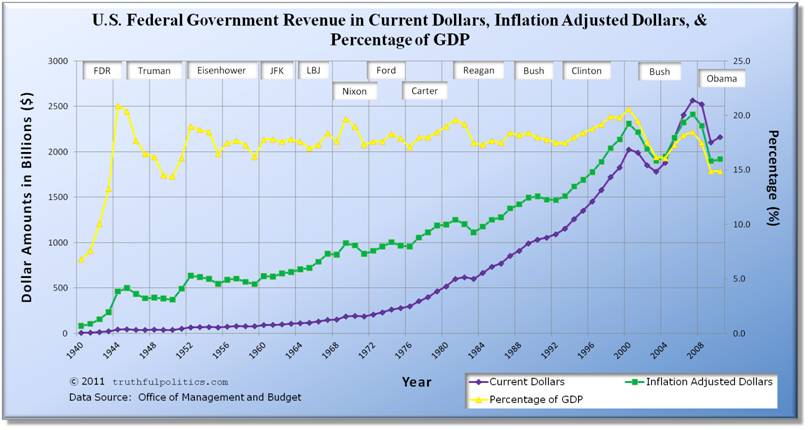
To my eye what that says is that whether you measure tax revenues in terms of dollars, inflation-adjusted dollars, or as a percentage of GDP we have not cut taxes. Let’s dig into the most generous assessment (percentage of GDP).
Basically, revenues as a percentage of GDP have been flat since 1980. What are true are that a) marginal rates have been cut and b) we have not increased revenues as a percentage of GDP. From that at most I’d conclude that marginal tax rates are not economically relevant. Now let’s consider deregulation.
Here’s a telling chart of economically significant regulations issued by year since 1980:

The story that graph tells is pretty conclusive. Regulations have increased year on year, administration on administration since 1980 and that includes during the Trump Administration when you take 2020 into account. But even that doesn’t tell the whole story.
Federal regulations are cumulative. Unless expressly removed which only happens very rarely they increase year by year. Here’s a graph of the number of pages in the Federal Register, the official journal of the federal government’s agency rules, proposed rules, and official announcements:

Under the Trump Administration there may have been a small reduction in the total amount of regulation but arguing that we’ve been cutting regulations for decades is one step too far. How about welfare?
Here’s a graph of federal welfare spending as a percentage of GDP:

The different colors represent the major categories of welfare spending (unemployment, families and children, housing). All sorts of things might be concluded from that chart. That welfare spending has decreased is not one of them. But even that graph does not tell the whole story because it doesn’t include healthcare spending. Here’s a graph of federal Medicaid spending over the last 20 years:

If you’re wondering about Medicaid spending since 2015, that has increased, too, but has roughly maintained the same percentage of GDP. So welfare spending hasn’t been cut, either. How about monetary policy? Have we had a tight monetary policy over the last 20 years?
The answer to that is a resounding “No”. As it turns out there’s actually a way of measuring the looseness or tightness of monetary policy, cf. “the Taylor Rule”. The graph below illustrates the relation of the Fed Funds rate to various forms of the Taylor Rule:

Summarizing what that graph says in words, monetary policy was too loose from 2001 through 2005 and has been too loose since 2008. That’s 17 of the last 20 years. Even shorter: we have not had a tight monetary policy. We’ve had a loose monetary policy.
I’m going to try and wrap this post up. Don’t mouth political nostrums at me. If you’re going to make an argument based on your observation that certain things have happened, be prepared to support your views with evidence. Right now I don’t believe the available supports the notions that we’ve actually cut taxes, deregulated, cut welfare, or had a tight monetary policy. What has been done is that we have lower taxes, fewer regulations, less welfare and a tighter monetary policy than might otherwise have been the case in the absence of countervailing actions. That’s not the same as low taxes, few regulations, less welfare, and tight monetary policy.


