Take a look at this graphic from Bill McBride at Calculated Risk illustrating total and one-unit housing starts since 1968. It’s pretty startling.
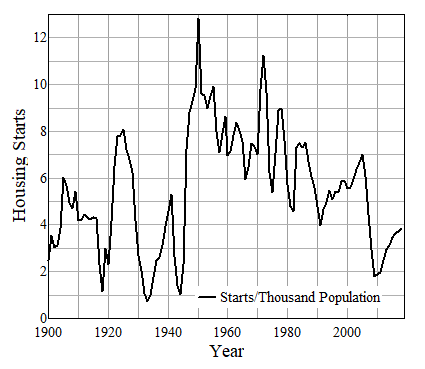
Also, see this chart of housing starts per 100,000 since 1900.
Maybe this is one of those &“glass half empty, glass half full” kind of things. I suppose you could look at it as housing construction has nowhere to go but up.
I think, on the contrary, that it illustrates the shape of the new normal. I don’t know whether the reasons for that are demographic, the end of the bubble that started in 2001 (or, arguably, earlier), other reasons, or some combination. But when you haven’t seen anything like it for two generations, as is the present case with housing, you’ve got to admit that something basic has changed.
Update
Karl Smith, looking at multi-family housing starts, sees the glass a half-full:
The “hopeful†argument is that while the absolute increase is much smaller this time around the pace is actually a bit faster, a four-fold increase rather than a 3-fold increase.
However, given the current conditions in housing I was looking for an even stronger snap back. This alone will not be enough to push the economy into a boom. We need a series step-up in the rate of growth.


There is high demand for apartments in many big metro areas. Whether local governments will allow them to be built by relaxing zoning codes is questionable. Current homeowners only want big houses to be built near them. How many young people could buy a big expensive house any time soon? I expect more multi generational households.
Mercer, I recently saw an article discussing design changes in new homes to accomodate multigenerational households. That is not really a good sign.
My interpretation of the rise in demand for rental is that there has been a generational shift and the younger adults are going to delay buying for much longer than before. Probably a good thing for them if they do.
I’m renting, but then I expect to move in 3-4 years. The rental market is hot right now in my area of Florida so we’re paying a premium over what ownership would likely cost on a monthly basis. BUT, without any idea of values have bottomed out, and with high transaction costs, it didn’t make much sense to buy – at least it doesn’t appear to make much sense.
Oh, and I think the tightening of lending rules is playing a part. Americans are delveraging which means they probably don’t have much savings which means they don’t have down-payments which means they aren’t looking for a house. That’s one theory anyway.
I closed on a refi on Friday, and FWIW I didn’t see much different from my last refi about eight years ago. I thought they would require an appraisal; the last one on the house was about twelve years ago at purchase. I also thought there would be a greater problem with my proof of income. I don’t receive W-2 wages, and its been suggested before that they might need a financial audit of my business, but they’ve never required it and didn’t this time. I’ve always assumed that among these stories about people getting loans without convention proof of ability to pay included me. Otherwise, the process had about 10% more papers to sign (that I didn’t read) than last time.
Most disturbing was that as I left, the loan officer cheerfully said she expected to see me next time rates drop. Rates are going drop more? [shivers]
Wow, that is a substantial discount rate you got there Dave.
My problem with this thinking is that when you look at the longer term graph you are basing your conclusions on a very tiny sliver of data and giving that all of the weight and discounting all of the past. Completely.
I’m not saying things are going to go back to 2005 or something like that, but that in looking at the past we have had substantial drops in housing starts on a per 1,000 basis in the past.
What I do find interesting is the long term downwards trend since the 1940s. Basically the end of WWII.
You’ve got to read this to believe it.
http://www.forbes.com/sites/halahtouryalai/2012/04/11/foreclosure-frenzy-bank-of-america-sues-bank-of-america/
BofA is apparently being run by this guy.
In looking at the graphic it is completely obvious that the moment George Bush took office the housing bubble started and then of course ended in disaster. Nyuk, nyuk, nyuk
I have always thought Dave was correct in drawing our attention to local or regional issues when it comes to housing. Given the boomers current median age I suspect we will see housing starts and prices relatively “glass half full” in places like south Florida, Scottsdale, so Cal, the Carolina’s etc. it’s just a demographic reality. I pity the fools who were buying at the top on the outskirts of certain Midwestern or northeastern states. Think IL, OH, PA NJ etc. Bad tax states. Bad commuting states. Bad job creation states. Bad weathe r states.
Good luck.
@PD Shaw
Your refi was probably a streamlined version. The VA will allow a streamlined refi with a few conditions. It must be done with the same mortgage company, the rate needs to be lower, and the payments need to have been on time for the previous year. There may be minimum time limits between refi’s and length of ownership. The closing are dramatically reduced, and they can be rolled into the back.
I guess they figure that if you have been paying a higher note, you will be able to pay a lower one. This is the goal of one of the Government programs. It makes sense to me, but what do I know.
The Best Execution Rates are hovering at the lower limit. VA rates are 3.75, and as I understand, that is the limit. Conventional loans are around 4.00, and the dip down to 3.75. I think the changes at this level are the points paid.
“For the Snark was a Boojum, you see.”